Samir and I wrote recently about the impact of seed funds in securing follow-on financing. That post aimed to help founders pick the seed-stage funds most likely to help them secure later financing.
This second post adds detail and perspective for seed-stage focused General and Limited Partners. Leveraging data from CB Insights, we created League Tables that identify seed funds with the top follow-on rates each year.
With the current array of emerging managers and compressed fundraising cycles, GPs and LPs must use intermediate measures to benchmark fund performance—cash-on-cash returns simply aren’t known until it’s too late. Measures like Internal Rate of Return (IRR) and Total Value of Paid in Capital (TVPI) are used to grade funds in their middle years.
We believe that follow-on rates are also a core metric and critical to understand a young fund’s performance. High follow-on rates are fairly well correlated with high Investment Multiples and IRR.
While benchmarks for Internal Rate of Return and Investment Multiples are readily available, the data for follow-on funding has been fairly limited.
GP's and LP's: Follow-on Rates Matter
General Partners
General Partners want to know how to drive fund results in early years. They want to track whether they are performing and need to measure the early signs of long-term returns. And most managers are seeking to build a long term franchise with successive funds.
How should a GP drive follow-on results? Aside from picking good companies and making them more valuable, they need to be systematic in helping secure the next round. This means preparing startup founders for their next raise, clarifying financing milestones, and building rapport between founders and the best downstream investors. GPs should know when a deal is right for other firms and build a reputation for bringing them the deals they want to get into.
Follow-on investments validate a seed fund’s early bets. It’s evidence for your strategy. And in a rough-and-tumble year like 2016, it shows that your portfolio and approach is strong enough to navigate a tighter market.
Limited Partners
Limited Partners want to know which new fund managers will be tomorrow’s winners. As Cambridge Associates writes, for the last 10 years,
“40–70% of total gains were claimed by new and emerging managers, a clear signal to investors to maintain more constant exposure to this cohort.”
But identifying the best new managers is not easy—the best can come from unexpected backgrounds and with completely novel strategies—and many LPs say they struggle to separate signal from noise. In this context, a high follow-on investment rate is one of the strongest early signs that a young fund has an opportunity to become an outlier. This is especially true if the quality of follow-on investors is high.
Looking back a few years, it’s clear that the funds with follow-on outperformance ended up with investment multiple outperformance as well.
The League Tables
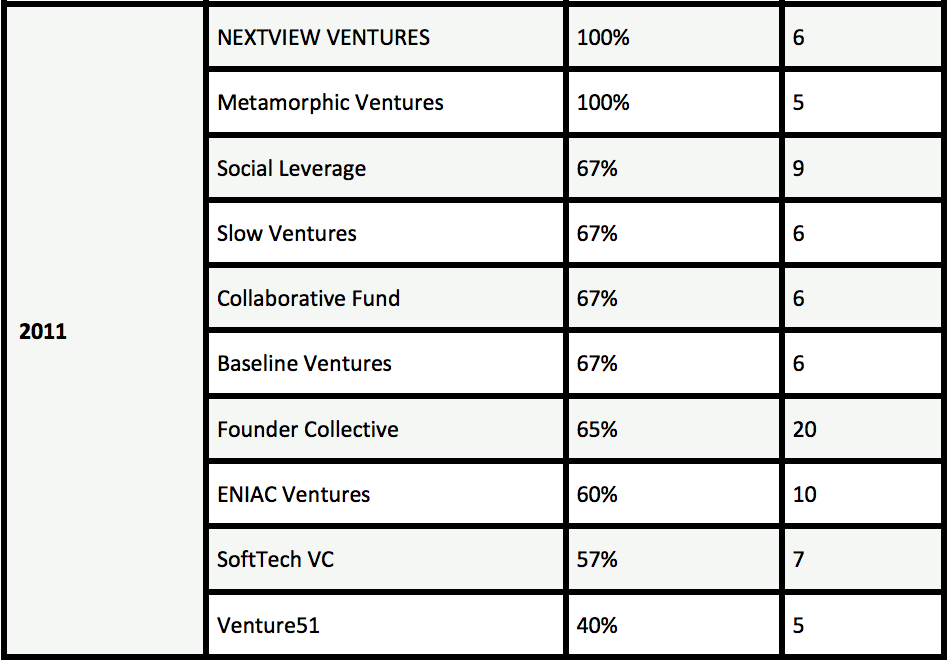
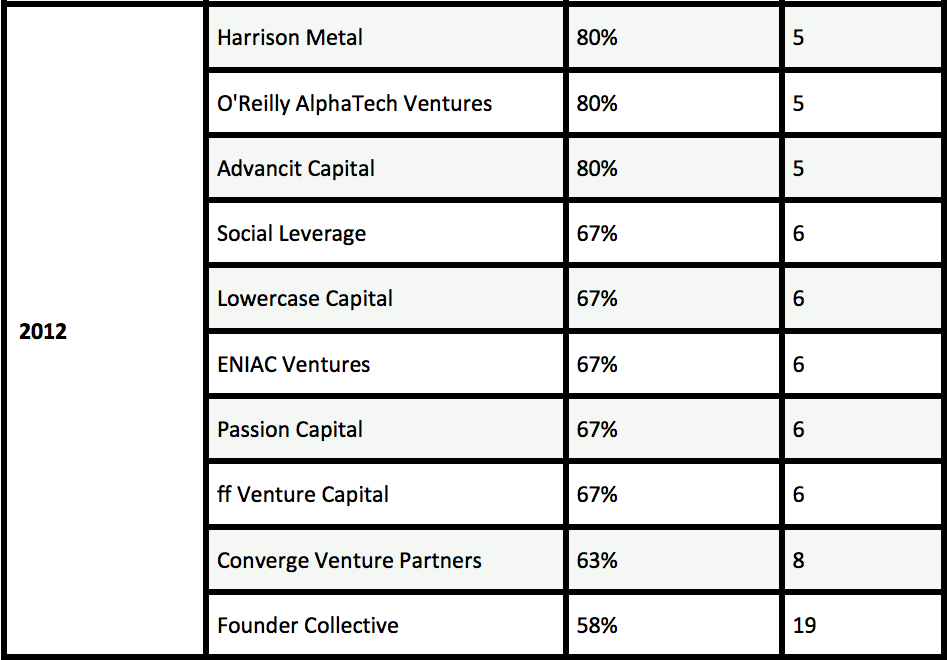
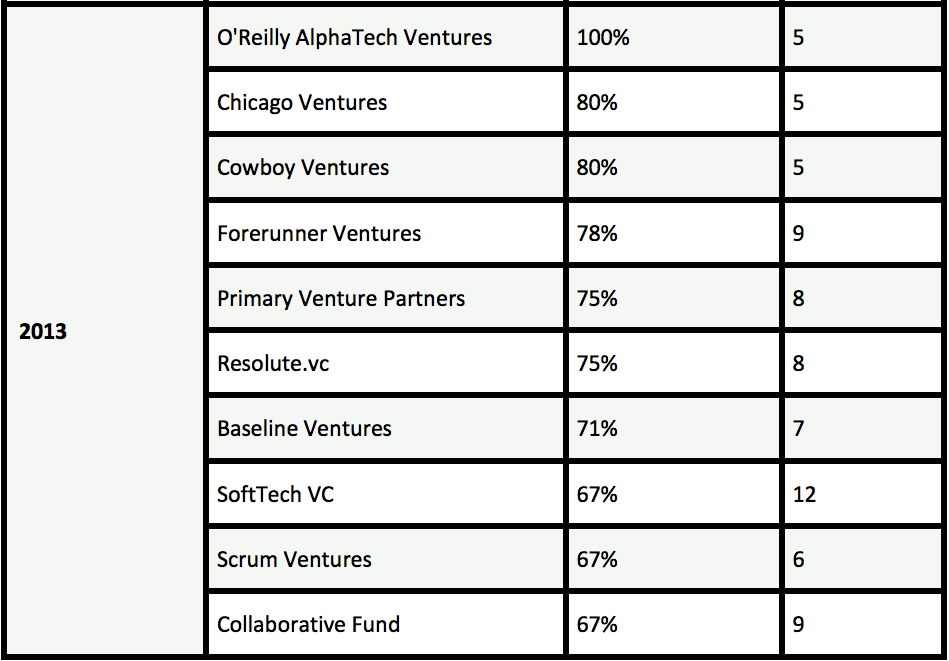
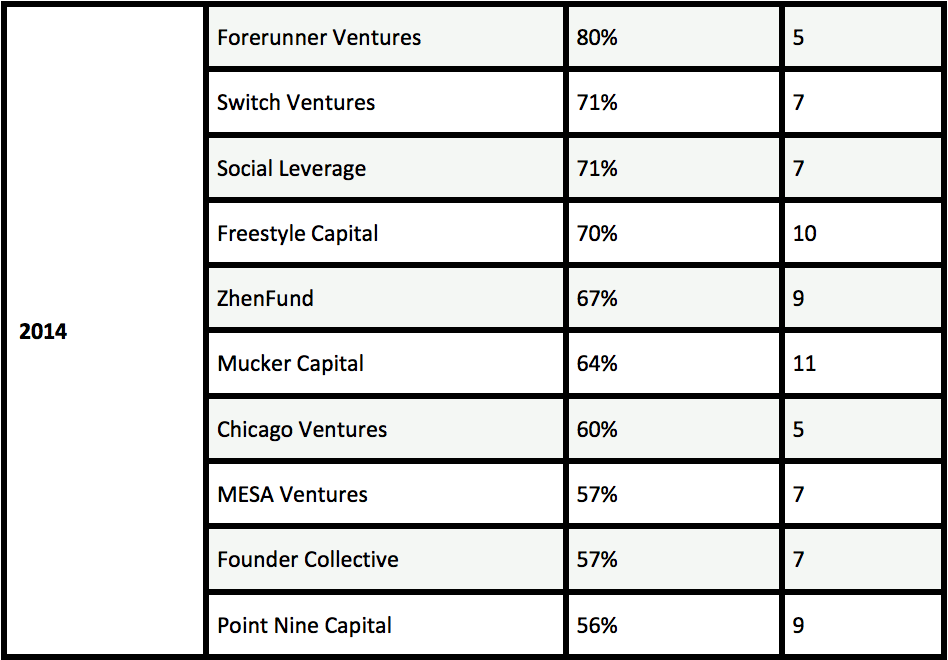
To highlight the best seed funds each year, we created League Tables of the top ten firms from 2010–2014 that made at least five investments in a year. These are deals that have been tracked and recorded as seed rounds by CB Insights. A follow-on round is defined as a subsequent financing round of greater than $2.5 million and does not have to be formally characterized as a Series A.
The League Tables list the performance of firms for each investing year, sometimes across multiple funds. In earlier years (like 2010), the data confirms the connection between follow-on rate and a fund’s eventual performance. In recent years (like 2014), the data highlights tomorrow’s most likely high-performers.
Top Micro-VC Investors by Investment Year
Several insights from these League Tables stand out.
A strong leading indicator of fund performance
The list is populated with firms most LPs would have been very happy to invest in. Not only does follow-on rate predict the future leaders and top-quartile funds fairly well, but it even seems to signal some true outliers like Baseline and Lowercase—two single GPs with young funds in this data, who had record-breaking performances, earning them second and third place in this year’s Midas List.
The gap has grown between the best and the average funds
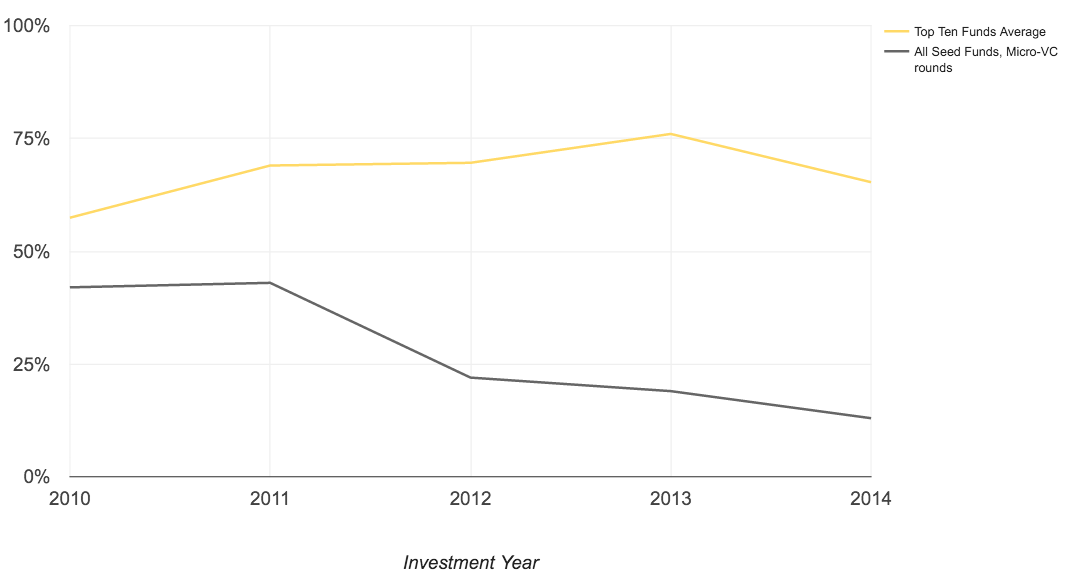
While the best funds are driving consistent performance of greater than 60% follow-on, the average fund follow-on rate has come down. This is likely a result of the market expanding and of many new seed funds coming to the market, many of which may be making lower-quality investments. More than ever, top firms are separating from the pack in this environment.
Seed Fund Follow-on Rates
Top firms make repeat appearances
Unsurprisingly, many investors, such as SoftTech, Forerunner, Lowercase, and Baseline—all widely considered to be incredibly strong performers—make several appearances across investment years.
Taxonomy for Measuring Performance: Different Measures for Different Times
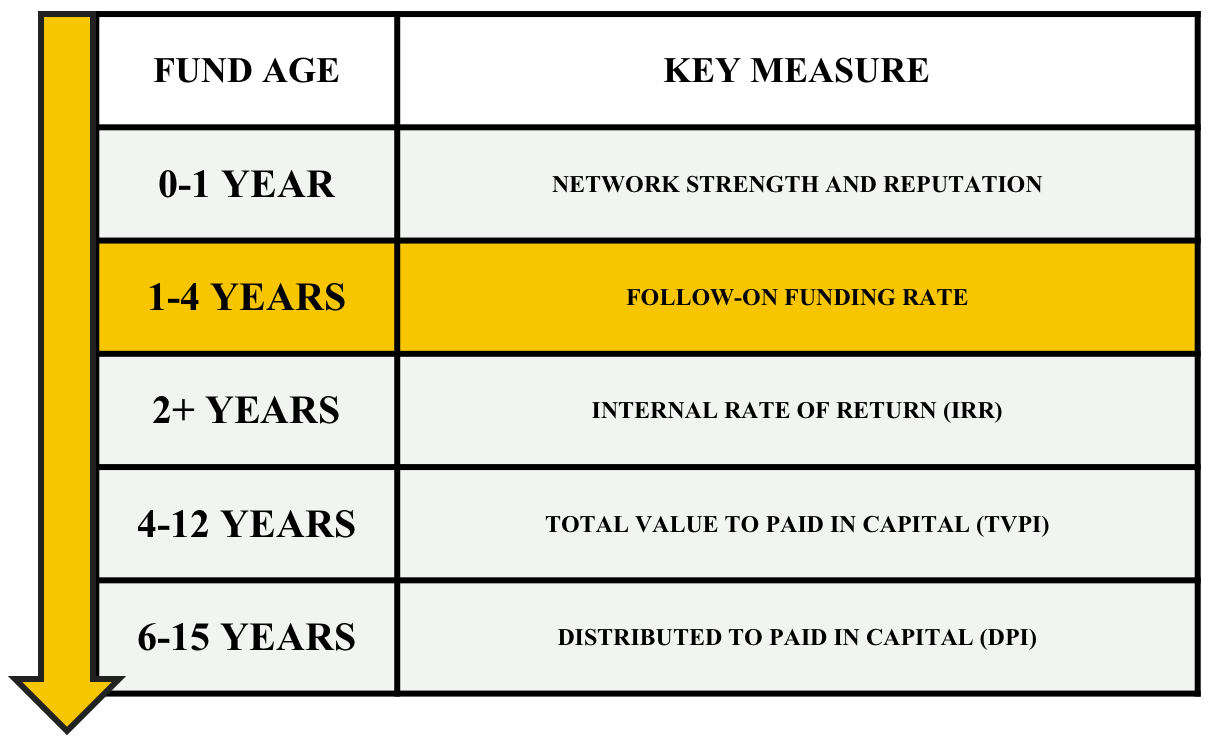
Different metrics matter at different stages in a fund’s life. You shouldn’t measure funds of different ages against the same metric. Rather, you should evaluate the strongest indicator for the fund’s age. We offer a simple taxonomy for thinking about this across different periods of time.
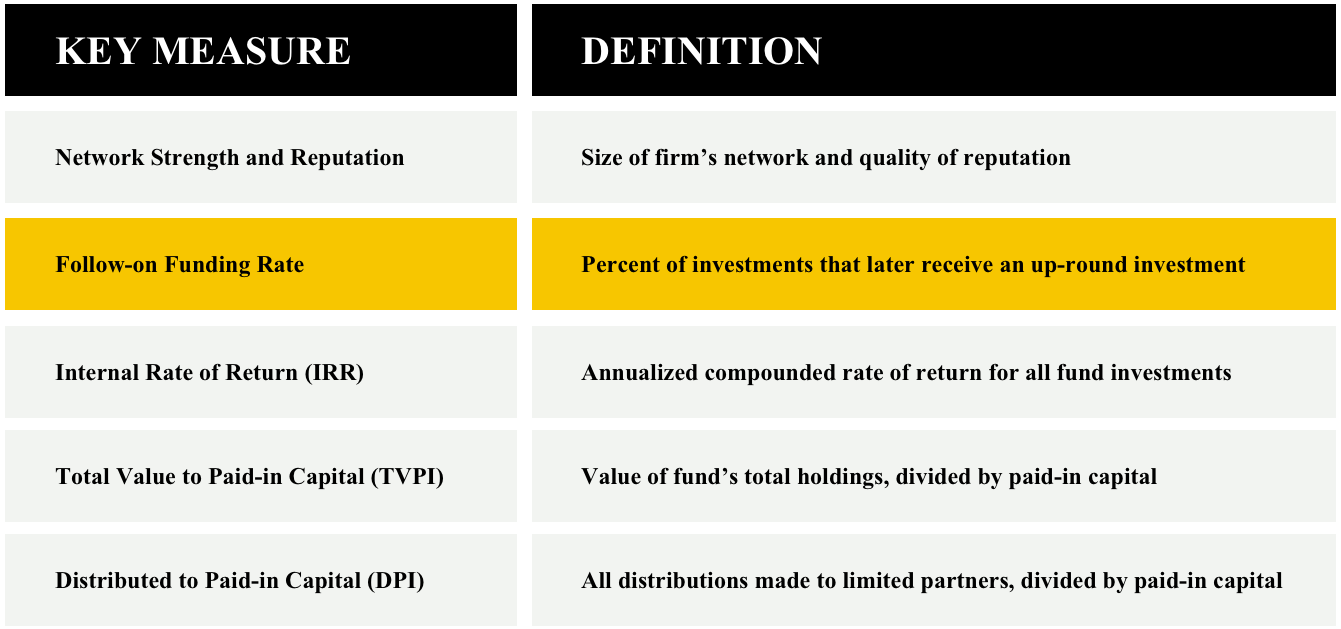
Definitions
Just a few closing notes on using each of these measures:
Network Strength and Reputation. In theory, this can be measured by analyzing deal partners, professional networks, and NPS. In practice, it’s easier just to ask around.
Follow-on Funding Rate. This is a leading indicator of the returns the fund will generate in later years. It’s very useful for assessing young funds before hard return metrics become more relevant.
In addition to quantity of follow-on, it’s worth considering the quality of follow-on. Some factors to consider include the following:
- Did the follow-on round come in a tough or easy environment?
- Who followed on? Follow-on investments by top investors indicate strong company potential.
- Larger rounds indicate a stronger commitment and are a clue that a startup is on an aggressive path.
- Rounds tied to operational milestones are stronger signals than those tied to a company’s cash needs.
Internal Rate of Return. This can either be realized on cash distributions or unrealized on shares still held by the fund. In early years, it’s a decent, though imperfect, leading indicator of future returns. In later years, it’s useful as a way to time-weight overall returns and, for the financially disciplined, to assess against the costs of capital.
Total Value to Paid-in Capital. This is a mid-horizon and important measure of ultimate fund performance.
Distributions to Paid-in Capital. This is the ultimate measure, but since it only starts showing up in year six (and is not fully realized until, perhaps, year fifteen), you need to look to earlier indicators to see where a fund is heading. DPI should be supplemented by IRR to account for time.
Thanks to Chris Douvos, Elizabeth Clarkson, and Alison Barad for their helpful thoughts on this post.
This post was coauthored by Paul Arnold (@paul_arnold), Managing Partner of institutional seed firm Switch Ventures, and Samir Kaji (@samirkaji), Senior Managing Director at First Republic Bank.


